Data visualization is a complex field that encompasses a wide variety of formats and types of images. All information visuals can be divided into four distinct categories, which fall within a 2×2 grid. Data visualizations fall on the spectrum between conceptual to data-driven. They also can be classified as either declarative or exploratory. These four categories make up the four types of information visuals.
Conceptual-Declarative
“Idea Illustration”
These types of images use common visual metaphors to illustrate complex ideas and relationships. For example, you might draw a tree diagram to show how family members are related, or to show hierarchy in an organization. The aim of this type of visual is simplicity – they are used to make a complex concept or set of relationships more simplistic and easier to digest.
The visualization below is conceptual-declarative, because it gives us the overall picture of the types of people who have historically been chosen as Time Magazine’s most influential people of the year. The overall visual map uses a colorful grid to highlight the overarching themes of the types of people who have been influential in the past 90+ years.

Taken from Time Magazine, December 24, 2018
Conceptual-Exploratory
“Idea Generation”
Images created to explore different trends and patterns fall into the category of “conceptual-exploratory.” These images are often informal, sketched out as drafts to explore connections and relationships of different elements, ideas, relationships and patterns. The creator may develop several visuals to explore different ways in which the data might show trends, sketching out different perspectives of the same main ideas.
This image from 1659 shows an early idea of the path of Saturn around the sun, in relation to the path of Earth. The image was taken from Edward Tufte’s Envisioning Information. It’s a great example of an exploratory conceptual model, because it is based on very raw, informal scientific data through observation. As years passed by, and more elaborate scientific measurement tools were developed, we have been able to refine this conceptual model to show more accuracy in proportions and relationships. But for a first stab at looking at the rotational pattern of Saturn, I think Christiaan did a pretty decent job!
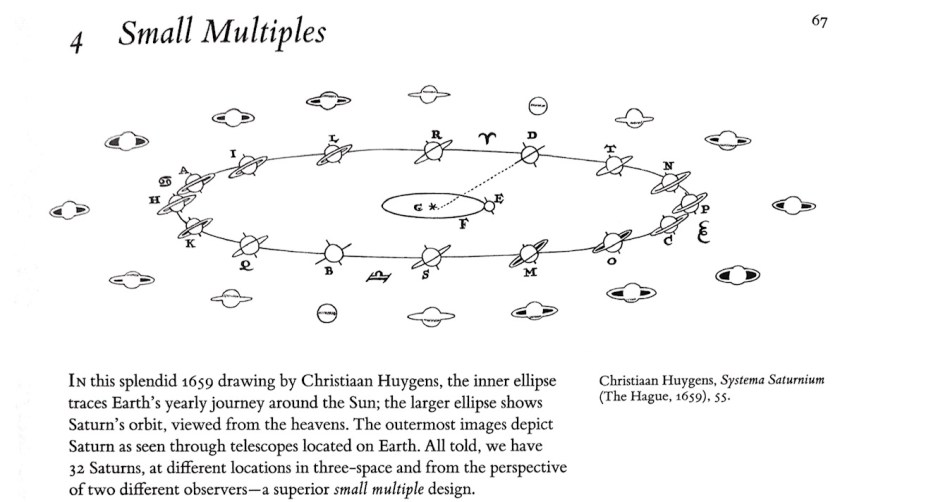
Taken from Envisioning Information, Edward Tufte
Data-Driven-Declarative
“Everyday Data Viz”
These images are the stuff that we encounter every day, in newspapers and magazines, on the Internet and in PowerPoint presentations. These are your typical line and bar graphs, pie charts, and scatter plots that tell us the story of a specific data set. They are created based on survey, polling and research results. They are the culmination of someone going around and gathering lots of data about a specific issue, and then presenting it in an easy-to-digest format. These types of charts are typically straightforward, factual, and self-explanatory in nature.
The series of graphs below present a clear picture of the partisan divide in the wake of the 2018 midterm election. The image first compares the breakdown of Democrats versus Replications currently in their congressional seats, and then looks at the change after the election results came in. The larger visual at the bottom them compares this data against previous administrations and the results of the midterm elections while each President held office. The overall visual is both strong and effective, due to its simplistic nature, comparison of two distinct colors, and the addition of numbers to complement the visuals.
 Take from Time Magazine, November 19, 2018
Data-Driven-Exploratory
“Visual Discovery”
The final category of information visuals are those that are generated using data, but that seek to explore a concept by answering a hypothesis. These images revolve around a central question, and the data is gathered and visualized to show the answer to that question in visual format – to either confirm or disprove the hypothesis. These types of visuals frequently combine lots of different data sets. They are often interactive -allowing the viewer to make adjustments to different parts of the data, and then evaluate the impact of those adjustments.
This visual was the closest I could find to a data-driven, exploratory graph. While not interactive, it does present us with visuals generated from collected data. The data is the presented to us in an intriguing way, asking the viewer to draw their own conclusions about what it all means. We naturally look at the presentation of the data and seek patterns, ask questions, and consider the implications. Due to the open-ended nature of this image, I feel that it can be classified as a “visual discovery” image.

From OurWorldInData.org, first seen on Twitter
Detail on four chart types gathered from Good Charts, by Scott Berinato, 2016 Harvard Business Review Press

0 comments on “The Four Types of Data Visuals”