Data is all around us, and the Internet gives us access to all kinds of public data sets, just waiting to be analyzed. While reliability of data found on the Internet can be challenging, there are a variety of organizations that are reputable for locating good sources of data. These data sets can then be downloaded, imported into Excel, and manipulated until they are displaying just the information that you want to see. The process of deleting columns of unwanted data, creating consistency of format of data within each category, and eliminating dramatic outliers is referred to as Data Cleaning.
Below I explore four datasets and the questions that I might be able to answer through analyzing them.
Cat versus Dog Ownership
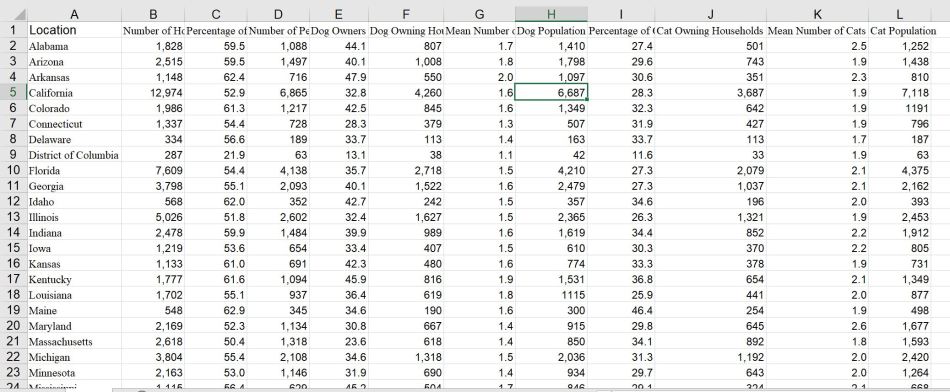
It’s the age old question – are cats or dogs more popular as pets? Living in a mixed pet household, I’d love to find the answer! A quick glance over the data reveals that people tend to own more cats than dogs. But how might that change based on region or state? Are cats more popular overall, or do people just tend to have more of them?
This fun dataset was found on the Tableau Resource website, as a sample data set to play around with using that tool. This would likely be an easy place to start.
Online Enrollment Trends

As I worked in online higher education, this data set, which I found within the Digital Learning Compass: Distance Education Report, was interesting because it compared enrollment data from two different years. I was able to retype this data from the report into Excel in two different tabs. It would be great to locate another set of the same data, perhaps from 2018, to be able to compare trends over several different years.
Questions that might be answered with this data set include
- What are some overall trends we see in enrollment data over that three-year time period?
- Did public, private for-profit, or private non-profit universities see the highest decline (or increase) in online enrollments?
- Which states have the highest enrollment of online students?
University Offerings, Enrollment & Completion Data

This 2013 data set was found on the Tableu Resources website and it is enormous – with 1535 entries that span over 41 rows. I spent hours cleaning this data – eliminating unwanted information, simplifying the Doctoral degree information, deleting the extra four digit zip codes which came through on only about half of the entries, and creating consistency in the naming of the Universities. After spending all of that time, I realized that I could have procured a more recent data set from the IPEDS website itself…but this will work for experimental purposes!
This is an incredible resource, and I am happy to have stumbled upon it in my search. While not a data person, this would still be a great place to explore and find different trends in education. This particular data set, which I have simplified, should now be able to answer some basic questions such as:
- The distribution of colleges and universities across the country?
- Are there specific areas of the country which tend to offer certain kinds of degrees?
- What trends do we see related to completion rates of Bachelor’s degrees – are there any correlations between the completion rate and price? location? type of university?
- What trends do we see concerning women in higher education?
Pew Internet Research Trends
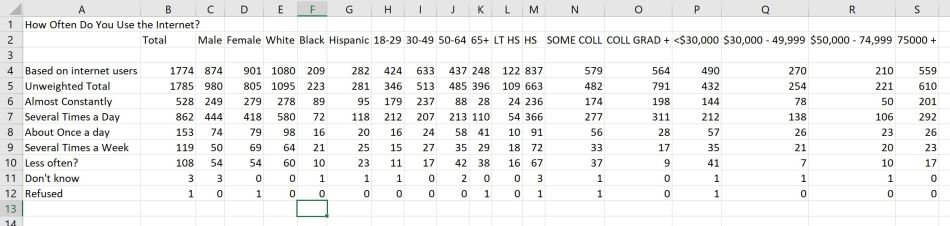
Finally, after much thinking about where I could find interesting data, I remembered one of my favorite places to read about statistics concerning internet, social media, and smartphone usage – the Pew Research Center! After digging around, I was able to download data sets from this fascinating organization. However I had some trouble figuring out how to make sense of the data. I started by typing into Excel the responses to one specific question within one of the trends datasets. I would like to figure out how to bring together data from multiple questions from within each survey, to find trends and correlations between answers.
This particular question asked about Internet use. It broke down the responses by demographics – male and female, age, race, education, and income. This would enable me to answer a few questions – but pulling in more data from this trends reports would be even more interesting. The questions I could answer here are:
- Who spends more time on the Internet – men or women?
- What trends do we see in Internet usage as the income level of the respondent increases?
- Similarly, what happens to the Internet usage when the level of education increases?
I look forward to further explorations of these data sources and these particular data sets, and how I might be able to use them to answer these questions!

0 comments on “Exploring Sets of Data”