Over the past seven weeks I have taken a course on Data Visualization – a topic about which I knew virtually nothing when I started. I was attracted to the class because of the visualization part – the syllabus called for markers and colored pencils. But once I dove in, I realized it was much about data. And I DON’T LOVE DATA.
In the end, I learned a lot in this class about thinking critically about the ways in which data is presented to us, and how we can present data to best represent the facts. It’s easy to tell tall tales through data visualization, with a little manipulation of line here, a little tint of color there. Being able to carefully evaluate the charts and graphs we encounter every day is a critical skill in our modern world.
My favorite part of the class was our deep dive into the Dear Data project, something I have followed for years, but finally was able to try out for myself. Tracking personal data and drawing visualizations by hand allowed me to explore a part of my creative side that I had yet to tap. The resulting postcards are mini works of art – and I can see myself continuing to engage in these visual self-studies.
Which brings me to my downfall in this class, Tableau. I’m sure Tableau is a perfectly nice piece of software. I’m sure that people who love data would love to bring it into Tableau and see the beautiful pictures it creates with the click of a button. Maybe if I understood what buttons to click, I would love it too. But rather than “using” Tableau, I found myself “battling” Tableau. In spite of all this, I was able to create a somewhat decent final project about student debt in the U.S.
Ultimately, I can see myself using the knowledge I gained in this course throughout my life, as a responsible consumer of news and information. The skills for visually representing data will also be useful in my role as an instructional designer and online professor – I may even dive back into Tableau in the future to create charts and graphs to represent educational content. However the most exciting takeaway for me is the exposure to the concept of Data as Art, a rabbit hole I can’t wait to hop down once I submit my final assignment. As an amateur fiber artist, I look forward to finding tactile ways to represent data through knitting, crochet, cross-stitch and embroidery. I hope to spend the rest of my summer doing just that.
The Burden of Student Debt: A Problem for All Ages
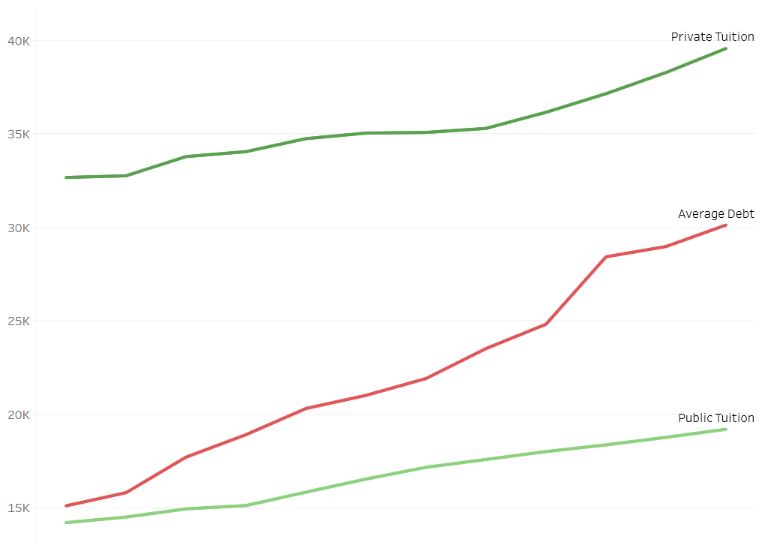
We all know that higher education tuition in the United States has been steadily increasing, and along with it, the amount of debt that students must incur to attend college. Drawing on data from the National Center for Education Statistics, I was able to create an Excel workbook with multiple sheets to compile different views into the issue of student debt.
Ultimately, I created an interesting story in Tableau, which explores various aspects of the problem and reaches the conclusion that erasing student debt for those with under $50,000 in loans would help a significant number of people. However, it should be noted that when it comes to my own personal position on eliminating student debt – I’m against it. The story I wanted to show would have reflected the fact that eliminating student debt disproportionately helps upper and middle class families, and those whose degrees will ultimately help them to repay that debt. I couldn’t tell this story because I simply could not find the data I needed, or wrangle it into the spreadsheets and from there into Tableau. So instead, I went with the story I could tell, and painted a broader picture of the student debt issue, and the impact of debt elimination as proposed by Elizabeth Warren.
Interested in exploring my data story? Take a look here: The Burden of Student Debt.

0 comments on “Data Visualization & Student Debt”